
Quick Diagnostic: What Your Screen Is Telling You
Before modifying another line of code or sending another prompt, find your symptom below to see the root cause and the immediate action to take:
| Screen Symptom | What Is Actually Breaking | Immediate Action |
|---|---|---|
| Blank / White Screen in Preview | Unhandled JavaScript runtime exception crashed React before mounting. | Open DevTools (F12), switch to Console, copy the red error stack trace. |
| Infinite “Fixing Issue” Loop | The conversation context is poisoned with broken diffs; the AI is hallucinating. | Stop prompting. Revert to a stable checkpoint in Version History. |
| AI Forgets Earlier Code / Loses Files | Project file tree exceeded the model’s active context window. | Create a .bolt/ignore file to block static assets and node_modules. |
| Runs in Preview, Fails on Vercel/Netlify | Environment variables were kept in browser memory and never synced to production. | Copy keys from .env directly into your hosting provider’s dashboard. |
| Data Won’t Load / Empty Arrays / 403 | Supabase Row-Level Security (RLS) is active without an explicit public read policy. | Run an ENABLE ROW LEVEL SECURITY + FOR SELECT USING (true) policy in Supabase. |
| Terminal Frozen / Keystrokes Ignored | Chromium tab hit its strict 2GB heap limit inside WebContainer. | Hard reload (Ctrl+F5); if frozen, eject the project to GitHub. |
There is a specific kind of sinking feeling unique to building with AI web apps in 2026.
You’ve spent two hours prompting Bolt.new or Lovable. The UI looks polished, your sample cards are rendering cleanly, and you’re one feature away from sending a demo link to your team. You ask the chat for what seems like a simple tweak—maybe wire up user sign-ins, or adjust a responsive navbar.
The progress spinner runs for ninety seconds. The preview window reloads.
And the entire right pane turns solid, unblinking white.
Your instinct is to click the little “Attempt Fix” button. The AI types out an apology, edits three files, and reloads again. Still white. You click it a second time, and suddenly your token meter jumps by 100,000, your daily credit allowance is depleted, and the app is more broken than when you started.
If you are currently staring at a broken preview or an infinite prompt loop: stop clicking “Attempt Fix”.
The problem isn’t that your app is impossible to build. The problem is that the chat window conceals the actual runtime crash happening inside your browser sandbox.
Here is what is actually breaking behind the scenes, how to uncover the real error in under thirty seconds, and how to rescue your project without burning through your credit allowance.
1. The “Blank Screen of Death”: Why the AI Chat Doesn’t Know What’s Wrong
The single most common failure in both Bolt.new and Lovable is the blank screen. You submit a prompt, the code editor shows clean green additions, but the preview iframe is completely empty.
The Mechanism
Whether you are building full-stack MVPs on Bolt.new or Lovable or generating modular components on v0 by Vercel, both platforms run your application inside an isolated sandbox—Bolt uses in-browser WebContainers, while Lovable uses a containerized cloud runtime. When your React code hits an uncaught runtime exception—such as attempting to read a property from undefined during the initial component render—the entire React component tree crashes and unmounts.
Because the crash happens on the client side inside the rendered iframe rather than during the Node build step, the AI agent in the chat has no visibility into it. The AI believes the development server started normally, leaving you stranded with an empty white container.
The Fix: The F12 Console Diagnostic
Instead of prompting the AI with “Why is the screen blank?” (which forces it to guess blindly and rewrite files that aren’t broken), inspect the browser console yourself:
- Right-click anywhere in your browser window and select Inspect (or press
F12on Windows /Cmd + Option + Ion Mac). - Click on the Console tab at the top of the Developer Tools panel.
- Look for the red error entries.
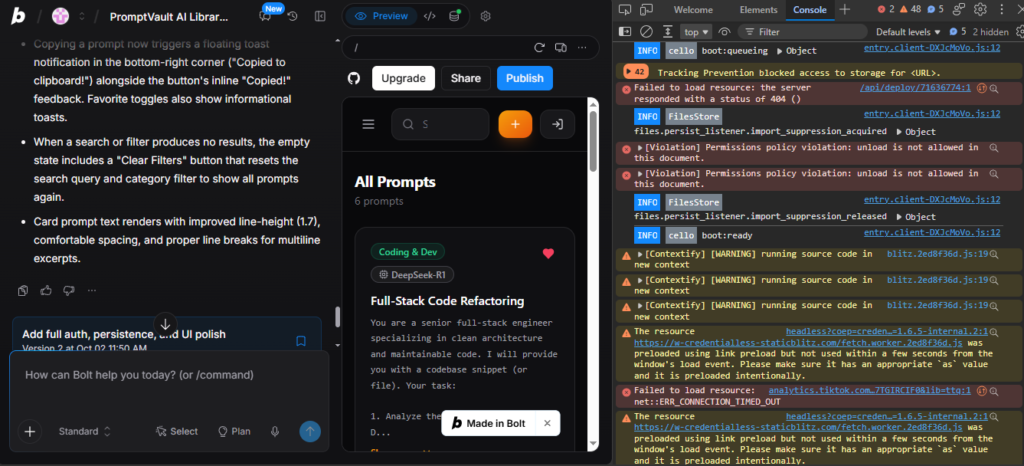
Once you see the red error, you don’t need to write the fix yourself. Simply copy the top two lines of the stack trace (for example, Uncaught TypeError: Cannot read properties of undefined (reading 'map') at FeatureCard.tsx:24), paste that exact line into the chat, and prompt:
“The preview is crashing on render with this exact console error: [paste error]. Please fix the undefined check on line 24 without modifying any other component logic.”
Giving the AI the exact line number from DevTools stops it from guessing and prevents destructive rewrites across your other files.
2. The Infinite AI Error Loop: Why “Attempt Fix” Makes Bugs Worse
Every builder has experienced this frustrating pattern: an error pops up, you click “Attempt Fix,” the AI generates new code, an entirely different error appears, and three prompts later your application architecture is mangled.
Why Context Poisoning Happens
Large Language Models rely on conversation history to determine their next output. When an attempted fix fails, that broken code, the error message, and the AI’s incorrect reasoning stay logged in the active context window.
By the third retry, the model is spending the majority of its reasoning capacity attempting to reconcile its own previous mistakes rather than your original application specifications. It enters a recursive feedback loop, burning 50,000 to 150,000 tokens on Bolt or 2 to 3 build credits on Lovable with every failed attempt.
The Rule: The Two-Retry Limit
Follow this strict operational rule: Never click “Attempt Fix” more than twice. If two consecutive prompts fail to resolve an issue, your conversation context is poisoned.
The fastest, cleanest way out is reverting to a stable state using Version History:
- Look at the top navigation of your chat pane for the Version History icon (or the history dropdown).
- Identify the last checkpoint where your UI was rendering cleanly.
- Select Revert to this version.
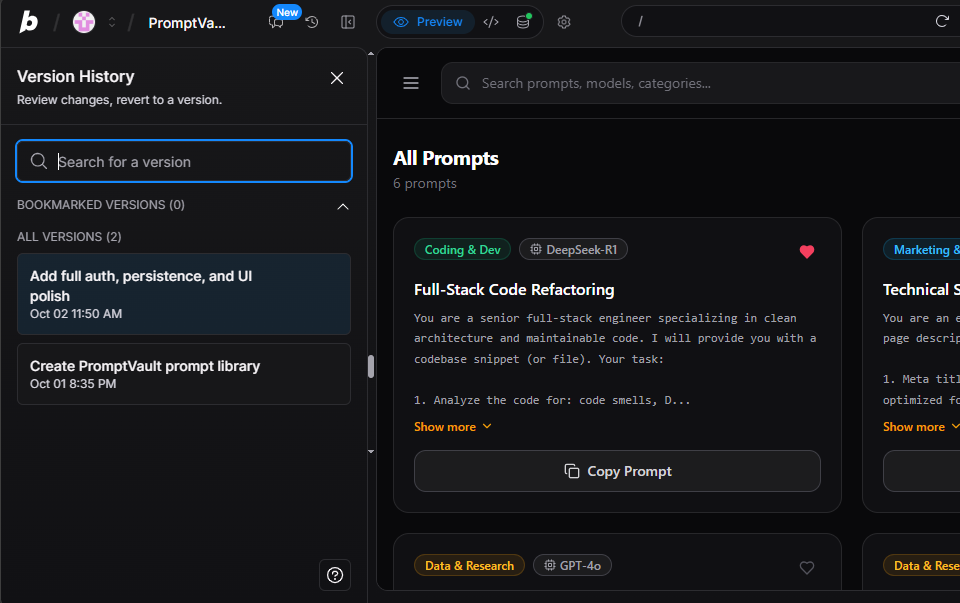
Reverting resets your conversation context back to when the codebase was healthy. From there, avoid repeating the large, multi-part prompt that broke it. Break your request into one isolated, single-responsibility step.
3. “Project Too Large”: Bypassing the Context Window Wall
As an application expands past 15 or 20 files, you may notice performance degrading: the AI begins “forgetting” features you built earlier, re-introduces bugs you already patched, or warns you that the project context is nearing capacity.
The Cause: The Unseen File Penalty
In browser-based dev environments, the agent reads your project tree to maintain awareness of your code. If your workspace contains static build assets, generated style files, or package locks, tens of thousands of tokens are wasted feeding static boilerplate into the model’s prompt window.
The Fix: Add a .bolt/ignore File
Just as .gitignore prevents unwanted files from cluttering your Git repository, a .bolt/ignore file instructs Bolt to exclude non-essential directories from the AI’s active context.
- In your Bolt file explorer, navigate to the
.boltfolder in the root directory. - Create or open the file named
ignore(path:.bolt/ignore). - Add the following lines:
node_modules/
dist/
.git/
public/assets/
*.lock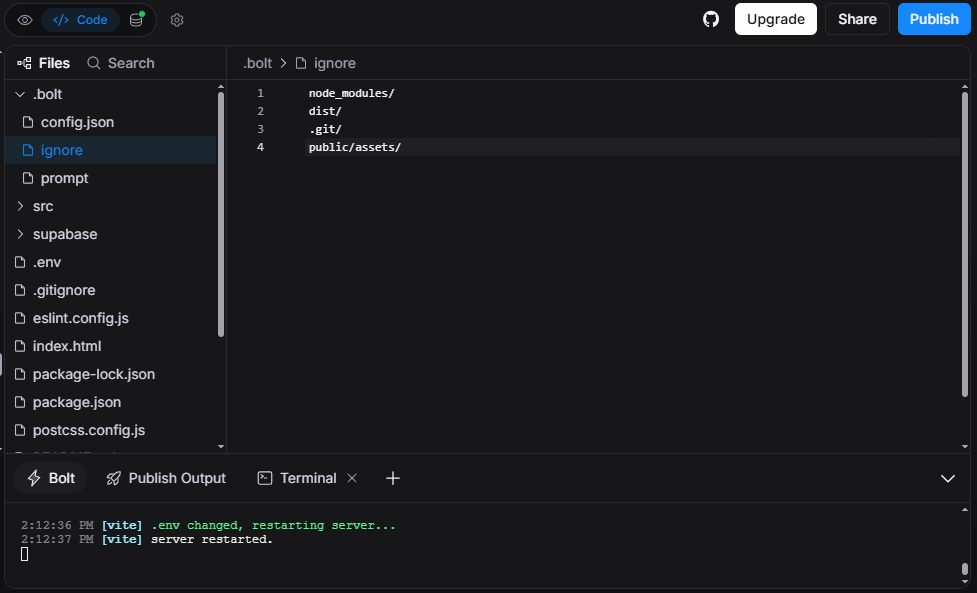
This simple 4-line configuration cuts prompt token consumption by 30% to 50% on every single generation, keeping your context window clear as your component library expands.
4. “Works in Preview, Fails in Production”: The Deployment Mismatch
Another major pain point in browser-based AI development is having an app that runs smoothly inside the preview sandbox, only to crash with a 500 error or blank screen the moment you deploy to Vercel, Netlify, or Cloudflare.
The Sandbox Illusion
When you test an application inside Bolt or Lovable, the platform injects simulated environment variables and proxies API routes inside its virtual container. When you push that code to a real production host, two common issues arise:
- Environment Variables Aren’t Transferred: If your app connects to Supabase, Stripe, or a third-party API, the keys were stored in your browser session. Your live hosting provider has no access to them unless manually configured.
- Missing Production Build Checks: Bolt often runs Vite in development mode (
npm run dev). Production hosts executenpm run build, which triggers strict TypeScript compilation. If the AI generated loose types that passed development mode,tscwill halt the production build with type errors.
The Pre-Deployment Checklist
Before sharing your live deployment link:
- Open your hosting dashboard (e.g., Vercel Project Settings > Environment Variables).
- Manually add every key defined in your project’s
.envfile (such asVITE_SUPABASE_URLandVITE_SUPABASE_ANON_KEY). - If your app uses authentication, navigate to your Supabase Dashboard > Authentication > URL Configuration, and add your live production domain to the Redirect URLs list. If omitted, users attempting to log in will be redirected back to
localhostor an expired sandbox preview.
5. Supabase 403 Forbidden: The Silent Database Failure
Both Bolt and Lovable routinely scaffold applications wired to Supabase for database storage and user authentication. But builders frequently hit a frustrating wall: user sign-ups work, but fetching records returns empty arrays [] or silent 403 Forbidden errors in the network console.
The Cause: Row-Level Security (RLS)
By default, Supabase enables Row-Level Security on all new PostgreSQL tables. RLS is a security mechanism that blocks all read and write requests unless an explicit policy grants permission.
When the AI creates a database table for your app, it often enables RLS without authoring the corresponding policy that permits public visitors to read those rows.
The Fix: The 30-Second SQL Policy
To fix this, you do not need to rewrite your frontend code:
- Log into your Supabase Project Dashboard.
- On the left navigation bar, open the SQL Editor tab.
- Paste the following script to create your table and grant public read access:
-- 1. Ensure table exists and RLS is enabled
CREATE TABLE IF NOT EXISTS features (
  id uuid DEFAULT gen_random_uuid() PRIMARY KEY,
  title text NOT NULL,
  created_at timestamp with time zone DEFAULT timezone('utc'::text, now()) NOT NULL
);

ALTER TABLE features ENABLE ROW LEVEL SECURITY;

-- 2. Allow public, anonymous visitors to read records
CREATE POLICY "Allow public read"
ON features
FOR SELECT
USING (true);- Click Run (
Ctrl + Enter).
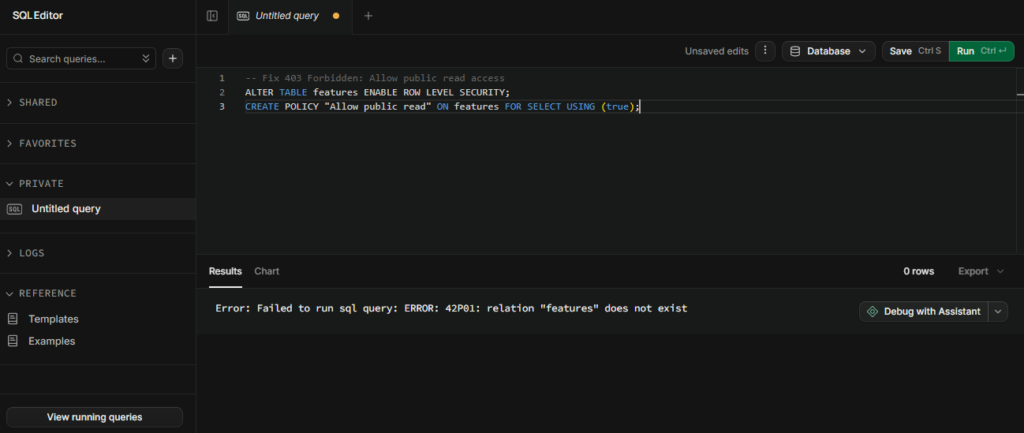
The moment this policy executes, reload your application. Your tables will immediately begin returning data to your frontend components.
6. Lovable’s SSR Hydration Warnings and Build Errors
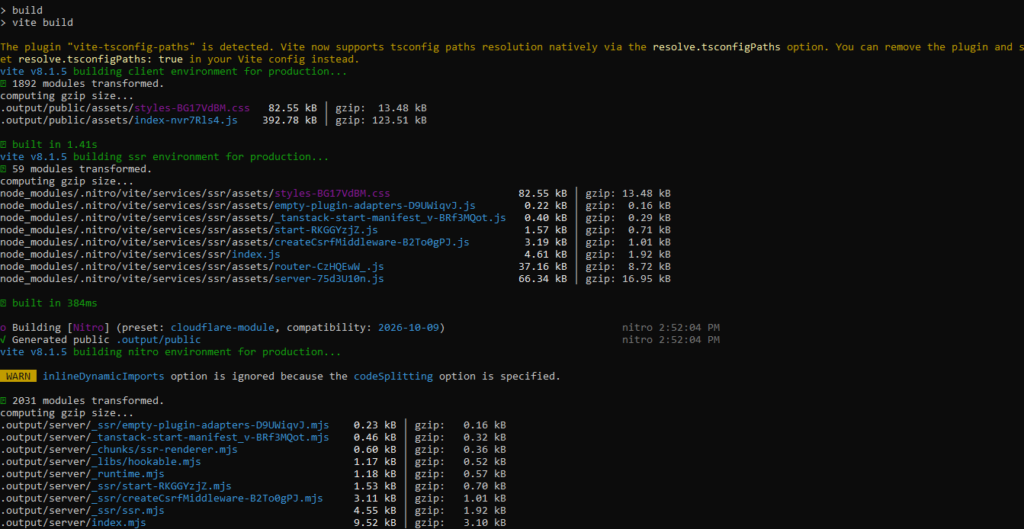
As we documented in our hands-on Lovable vs. Bolt.new benchmark and our v0 vs. Lovable architectural comparison, Lovable does not generate a lightweight single-page app. It generates an enterprise Server-Side Rendered (SSR) application powered by TanStack Start, TanStack Router, and Nitro, pre-configured for Cloudflare Workers.
While SSR delivers fast initial page loads and strong SEO, it introduces a common failure: Hydration Mismatches.
Why Hydration Fails
In an SSR architecture, the server renders the initial HTML, transmits it to the browser, and client-side JavaScript then “hydrates” the DOM to make it interactive.
If the AI wrote code that references browser-only globals during that initial render pass—such as window.innerWidth, document.title, or localStorage.getItem()—the server and client generate conflicting markup. The browser detects the discrepancy, throws a hydration warning, and can cause buttons, tabs, or dialogs to become completely non-functional.
The Fix: Guard Browser-Only APIs
If you encounter hydration warnings or build failures after exporting Lovable code, inspect your components for direct calls to window or localStorage.
Ensure browser-specific logic is guarded so it only executes after the component has mounted on the client:
import { useEffect, useState } from 'react';

export function UserSettings() {
  const [theme, setTheme] = useState('dark');

  useEffect(() => {
    // Executes strictly in the client browser, never on the SSR server
    const saved = localStorage.getItem('theme');
    if (saved) setTheme(saved);
  }, []);

  return <div>Current theme: {theme}</div>;
}
Wrapping browser-only calls in useEffect prevents the Nitro SSR compiler from throwing reference errors during production builds.
7. Terminal Frozen: When WebContainer Exceeds Browser Memory
Because Bolt.new executes a Node.js environment entirely inside your browser tab via WebAssembly, it is restricted by Chromium’s tab memory limits.
If you install multiple heavy libraries (such as Three.js, Lucide, Recharts, and Tailwind simultaneously), your browser tab can exceed its 2GB memory allocation. When this occurs:
- The in-browser terminal stops responding to keyboard input.
- The preview loading indicator spins indefinitely.
- The tab becomes sluggish or crashes with an
Out of Memorybrowser notification.
How to Unfreeze It
- Close Inactive Browser Tabs: Close background tabs to free up shared system RAM.
- Hard-Refresh Container State: Perform a hard refresh (
Ctrl + F5orCmd + Shift + R). - The Emergency Git Eject: If a project refuses to load because the browser container is overwhelmed, click the GitHub icon in the top navigation bar. Push the repository to GitHub, clone it to your local machine, and execute
npm install && npm run devinside VS Code or Cursor. Your local machine has access to your full hardware RAM, completely bypassing browser sandbox limitations for $0.
The Prevention Playbook: 3 Rules to Keep Projects Healthy
Fixing broken builds is important; avoiding them altogether is far more efficient. Based on dozens of hours building and auditing applications across major AI tools, here are the three operational habits that keep projects running smoothly:
1. The Single-Responsibility Prompt
Avoid asking an AI to build an entire feature set at once (e.g., “Build an authentication system, add Stripe billing, connect Supabase, and make the dashboard dark mode”). Multi-part prompts exponentially increase the probability of syntax and type errors.
Prompt in distinct, verifiable layers:
- Step 1: Layout and visual mock data.
- Step 2: Interactive state (voting, filtering, modal forms).
- Step 3: Database and backend integration.
2. Push to GitHub at Every Stable Milestone
Never treat an AI browser editor as your permanent code repository. The moment a feature functions cleanly, commit and push your branch to GitHub. If a subsequent prompt corrupts your codebase beyond repair, you have an immutable, version-controlled backup that cannot be lost to conversational drift.
3. Keep DevTools Open Early
Do not wait for your preview to turn solid white before inspecting DevTools. Keep your console open on a second monitor or docked at the bottom of your workspace. Catching a minor warning early prevents it from compounding into a fatal crash five prompts down the line.
Frequently Asked Questions
Why does Bolt.new get stuck repeating the same error?
When an AI attempts a fix and fails, that failed attempt remains logged in the chat’s active context window. The model begins referencing its own broken code, leading to recursive hallucinations. To break the loop, roll back to a prior checkpoint using Version History rather than repeatedly clicking “Attempt Fix.”
Can I run a Bolt.new project locally on my computer?
Yes. Bolt projects are standard Vite and React codebases. You can export the repository to GitHub or download the ZIP, extract it on your laptop, and run npm install followed by npm run dev in your local terminal without platform lock-in.
Why is my Supabase database returning empty data in Lovable or Bolt?
Supabase enables Row-Level Security (RLS) on new tables by default, blocking unauthenticated read queries. You must open the Supabase SQL Editor and execute a CREATE POLICY query granting SELECT permissions to public visitors.